SchoolRoutes: An approach for data-driven investment in safe routes to school
Robin Lovelace
Active Travel England and University of Leeds, UKSam Holder
Active Travel EnglandEmma Vinter
Active Travel EnglandAdrian Fletcher
Active Travel EnglandChris Conlan
Active Travel England and The Alan Turing InstituteDustin Carlino
Active Travel England and The Alan Turing InstituteSource:
vignettes/schoolroutes.Rmd
schoolroutes.RmdIntroduction
This outlines the methods and preliminary findings of the SchoolRoutes project. See the project charter for a full description of the project’s aims, objectives, and scope.
There is a large and growing body of evidence on the relationships between active travel, physical activity, and positive environmental, economic, social and health outcomes. Research supporting the Propensity to Cycle Tool (PCT) project, based on 2010/2011 English travel to school data, with the number of trips by mode at the origin-destination level, for example found that there was substantial unmet potential for cycling to school. Based on data from The Netherlands and considering English trip distances and hills, a 22-fold increase was found to be possible under the Go Dutch scenario, associated with a 57% increase in physical activity for pupils at state run primary and secondary schools Goodman et al. (2019).
While the PCT — and associated website which provides data downloads and evidence in a map-based web application hosted at www.pct.bike — has been widely used by local authorities and other stakeholders, there are several reasons to revisit the issue of mode shift potential for travel to school, and the specific question of active travel potential, now:
- School catchments and travel patterns have changed substantially since the 2010/2011 data on which Goodman et al. (2019) was based. More recent travel data can overcome a major limitation of that study by presenting current transport patterns to school.
- The travel to school layer in the PCT described by Goodman et al. (2019) provided only a single metric for segments on the road network: cycling potential (under a range of scenarios), without reference to key infrastructure datasets that could be vital when prioritising local interventions and identifying where ‘pinch points’ are in the network.
- The pandemic and subsequent restrictions on have been linked with alarming increase in childhood obesity rates and inequalities, as shown in Figure 1. This has pushed active travel for kids up the political agenda.
- The travel to school layer in the original PCT resulted in a sparse network in some places. This can be overcome using new methods for disaggregating OD pairs to show diffuse residential networks (Lovelace, Félix, and Carlino 2022).
- Perhaps most importantly, evidence presented in the PCT omitted the potential for walking to school, which is likely to be more important for shorter trips and for younger children, especially in the near term.
On the policy side, and as part of the UK Government’s Health Mission, health and wellbeing for young people has risen up the political agenda. ‘School Streets’ interventions featured prominently in all rounds of the Active Travel Fund (ATF) bids, yet there is a lack of evidence to support safe routes to school and where they should be located. More broadly, strategic active travel networks have already largely been designed, as part of the LCWIP process, while cost-effective interventions that fix ‘weak links’ in quiet/beginner networks have received less attention.
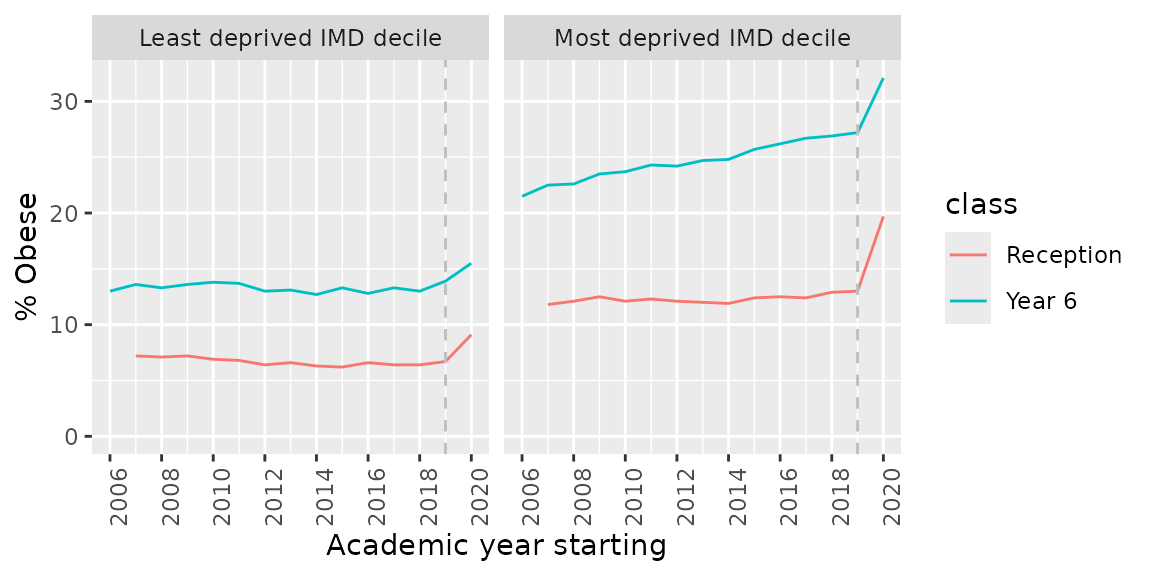
Childhood obesity rates in most and least deprived areas over time. Source: National Child Measurement Programme.
Objectives
As outlined in the project charter, the project aims to:
Generate estimates of active travel potential for school travel, based on separate uptake functions for walking and cycling.
Use ‘jittering’, described in an academic paper (Lovelace et al. 2022), to create a realistic distribution of school route starting points within LSOAs, generating dense networks connecting residential origins with schools.
Use 2023 origin-destination data from DfE, describing the number of children from each English LSOA travelling to each school in England.
Update cycling and walking uptake scenarios to reflect ATE targets and long-term aspirations.
Include route segment information on cycle friendliness and traffic.
Furthermore, the project will provide a basis for modelling active travel that can be applied to other trip purposes, as part of the Active Travel Uptake Model (ATUM) project in 2023. ATUM aims to replace the PCT, building on the Network Planning Tool for Scotland (NPT).
Data and methods
The approach outlined in this paper uses the following datasets:
- Origin-destination (OD) data on travel to school from the Department for Education (DfE) from Lower Super Output Area (LSOA) to schools (non-sensitive simulated OD datasets are used in the open access version of this paper).
- Data on state-run schools, including their locations, type (primarily primary, secondary), and other characteristics, from the Get Information about Schools (GIAS) service.
- OpenStreetMap (OSM) data for the road network, with value-added by
routing software such as
od2netto pre-process the data and generate route networks. - Elevation data, enabling hilliness to be factored into walking and cycling potential estimates.
- Datasets from the Modeshift Stars programme, which provides data on the number of trips to school by mode for a sample of schools in England (not currently used).
A methodological limitation of the PCT approach was that it used only zone centroids as trip origins, which can lead to a sparse ‘spider’s web’ of routes that do not reflect the actual routes taken by children to school, rather than the dense networks that are needed (see example in the case study section below). To overcome this, the approach taken in this paper is to disaggregate the OD data, modelling multiple origins or ‘subpoints’ within each zone, to better represent the geographic distribution of trips to school.
For each OD pair, the number of trips that could be walked or cycled is estimated based on route characteristics. For walking, the proportion of trips that can be walked () is modelled as a simple exponential decay function of distance, with parameters specifying the rate of decay (the exponent) and the maximum proportion of trips that can be walked, building on work by (Iacono, Krizek, and El-Geneidy 2010):
For cycling, the proportion of trips that can be cycled is based on the Go Dutch scenario in the Propensity to Cycle Tool (PCT) project (Goodman et al. 2019). These uptake functions are illustrated in the figures below.
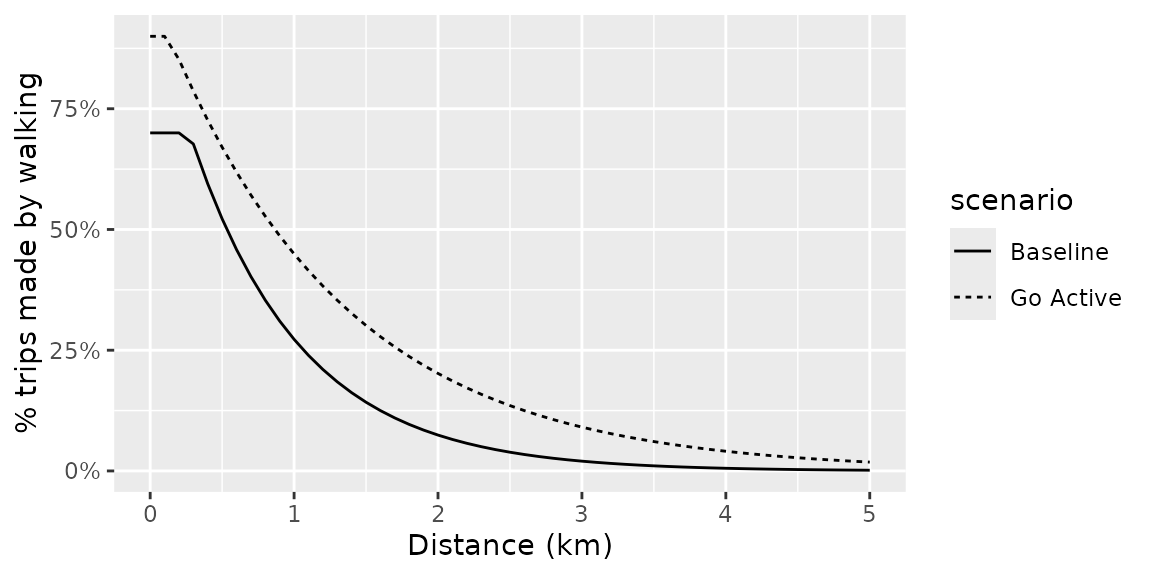
Uptake functions for walking to school, by distance, in baseline and Go Active scenarios.
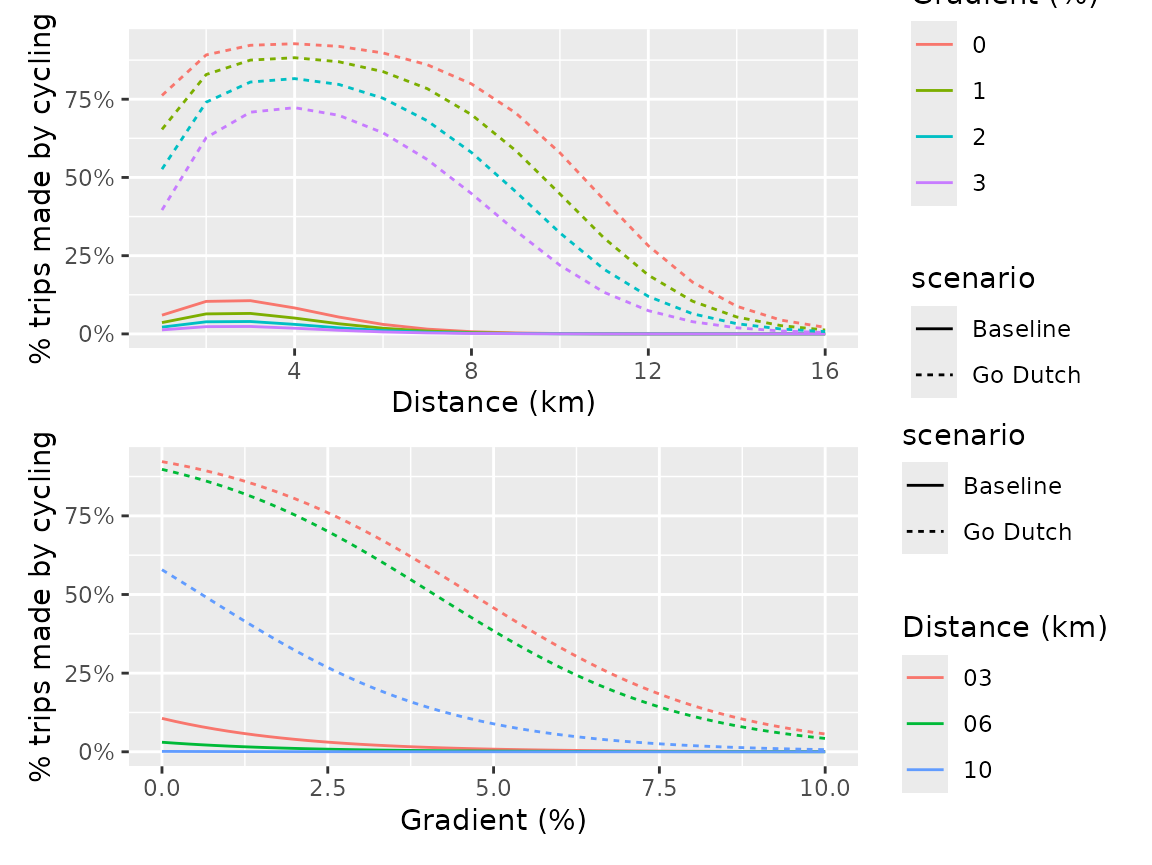
Uptake functions for cycling to school, by distance (above) and hilliness (below), in baseline and Go Dutch scenarios.
The figures above show that the proportion of trips made by walking and cycling for each OD pair depends on a function of distance for walking, and a function of the trip distance and hilliness for cycling. It is important to apply these function to the route distance and hilliness rather than the Euclidean distance, as the actual distance travelled can be much longer than the Euclidean distance, especially in areas with complex road networks or hilly terrain. After calculating the proportion of trips walked or cycled per route, the proportion is multiplied by the estimated total number of trips by all modes to estimate the number of trips that could be walked or cycled along each route. The route-level counts are then aggregated in a process that can be referred to as “travel flow aggregation” (Morgan and Lovelace 2020).
Case study: York
The approach uses the od2net tool, developed by Dustin Carlino on secondment to ATE from the Alan Turing Institute. The raw outputs can be visualised in the web app hosted at od2net.org, resulting in an interactive map of the routes, as shown in the Figure below. The od2net web application is useful for gaining a quick insight into the results, but is rather unrefined and not adapted to the needs of transport planning. This suggests a need for presenting the results in an alternative way, for example in the Scheme Browser tool hosted at plan.activetravelengland.gov.uk.
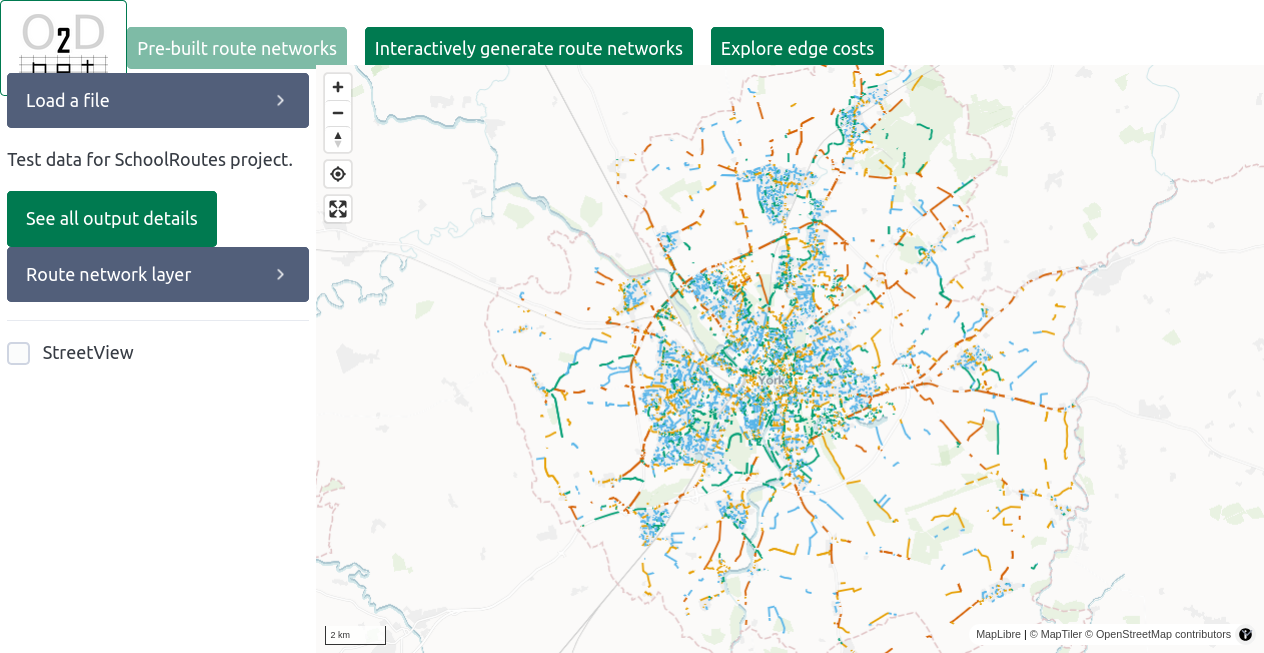
Routes generated by the SchoolRoutes project.
A useful feature of the route network level data outputs is that the can be imported and visualised for any local area using commonly available data science tools such as QGIS, Python and R. The figure below highlights this by showing the routes generated by the SchoolRoutes project within 1 km of Stratford Way, next to Huntingdon School, with colours representing selected variables.
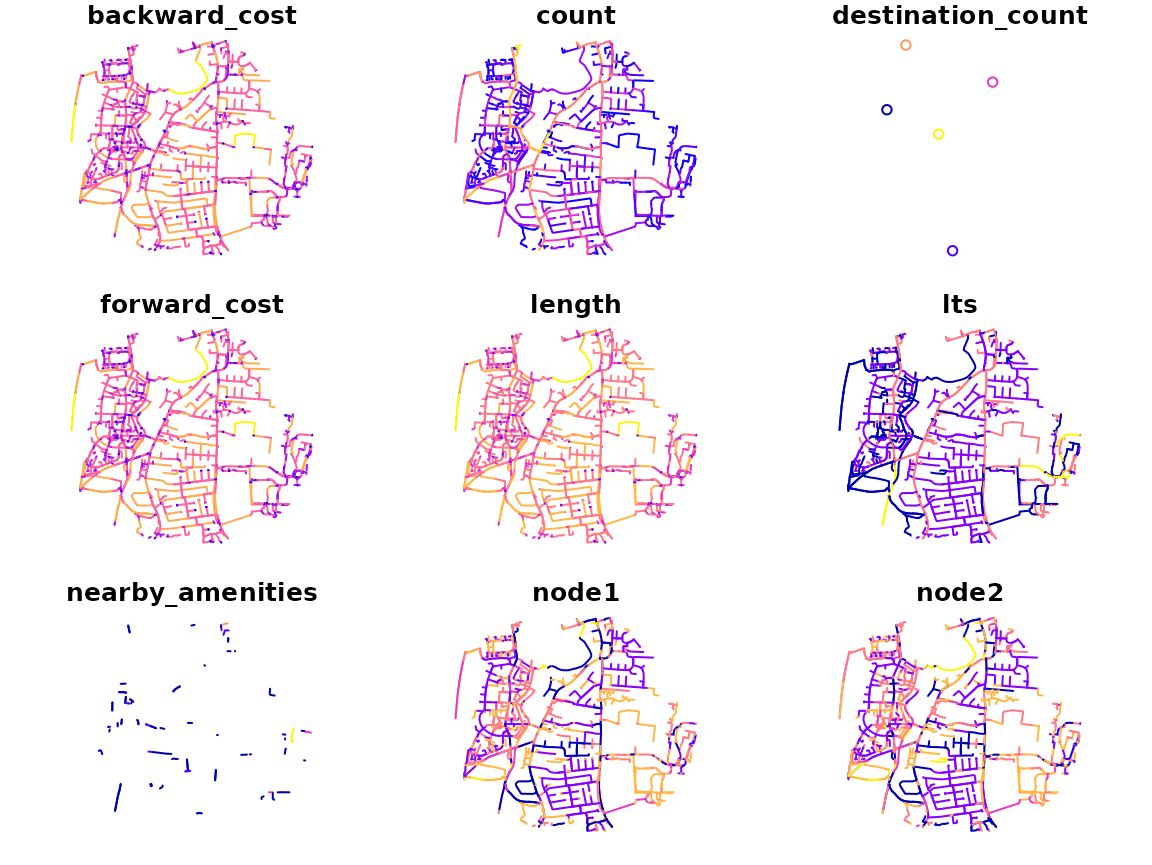
Routes generated by the SchoolRoutes project, with colours representing selected variables.
Of the output variables provided at the segment, presented in the figure above, the level the most relevant are:
-
count: the number of trips on each route segment. -
lts: the level of traffic stress (LTS) on each route segment. -
osm_tags: the OpenStreetMap tags for each route segment, for example surface quality, whether or not the segment is lit, and the maximum speed limit (the quality/coverage of these tags varies by region depending on the OSM community). -
way: the unique identifier for each route segment, which can be used to link to other datasets and to OSM, enabling people to view and update the data.
The output dataset can be visualised with well-known data science tools, as illustrated in the figure below. The figure shows the routes with the highest number of trips under the Government Target cycling uptake scenario (left), which represents a doubling in the number of trips made by cycling to school (Goodman et al. 2019).
The same approach can be used to estimate walking to school potential, based on the all-mode flows to school contained in the OD data. The results for walking and cycling surrounding Stratford Way are shown in the figure below.
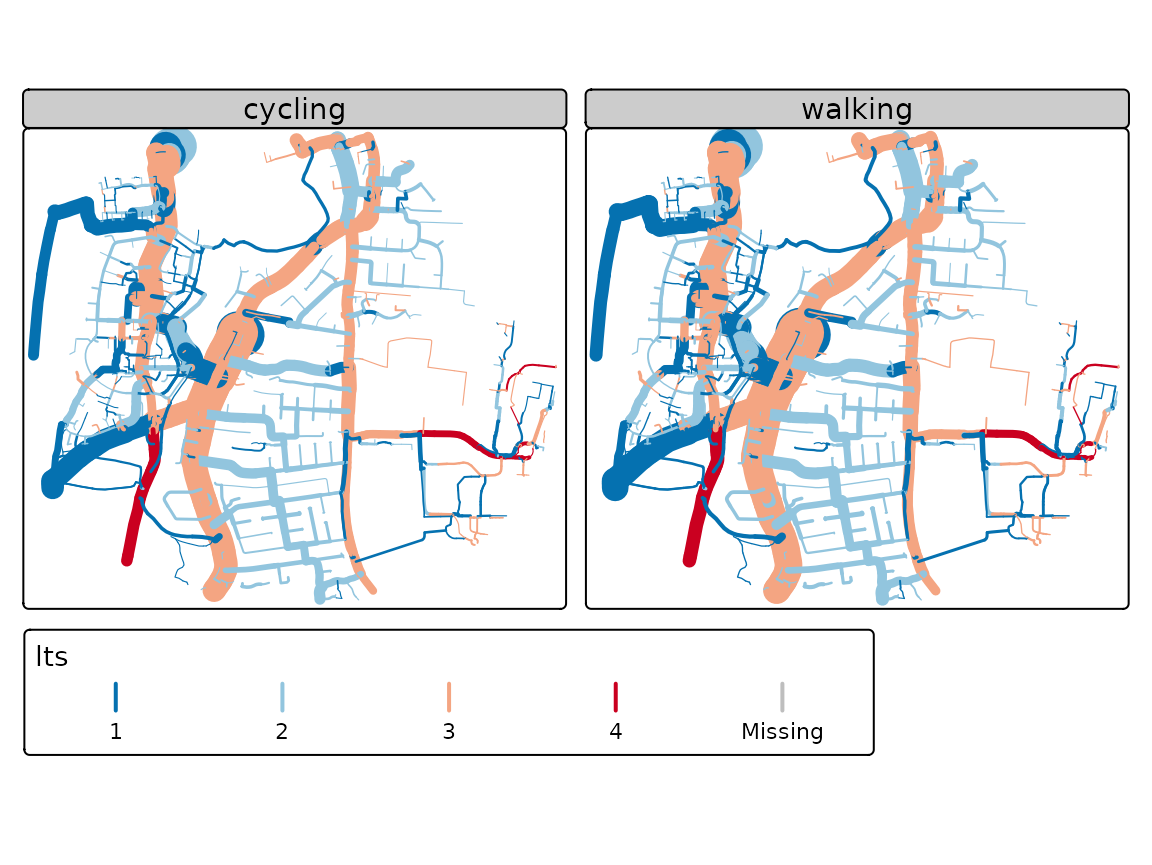
Routes generated by the SchoolRoutes project for walking and cycling, with colours representing level of traffic stress (LTS) and line width representing the number of trips, under the Government Target for cycling and Go Active for walking.
Note that the results for walking show that the number of trips is generally higher than for cycling close to the school, but as you move further away, the relative number of cycling trips increases. This highlights the fact that cycle networks around schools need to be longer than walking networks.
Prioritising investment with SchoolRoutes evidence
A simple way to prioritise investment based on the route network outputs shown above is to find the LTS3 and LTS4 roads with the greatest potential. A key output from the tool will be route network data that contains both the potential number of trips and the LTS classification of each road segment. Taking a hypothetical scenario in which there is sufficient funding for investment in 5 school streets, targetting the worst (LTS3 and LTS4) roads in York, the data allows us to identify the roads presented in the Table below and the Figure below.
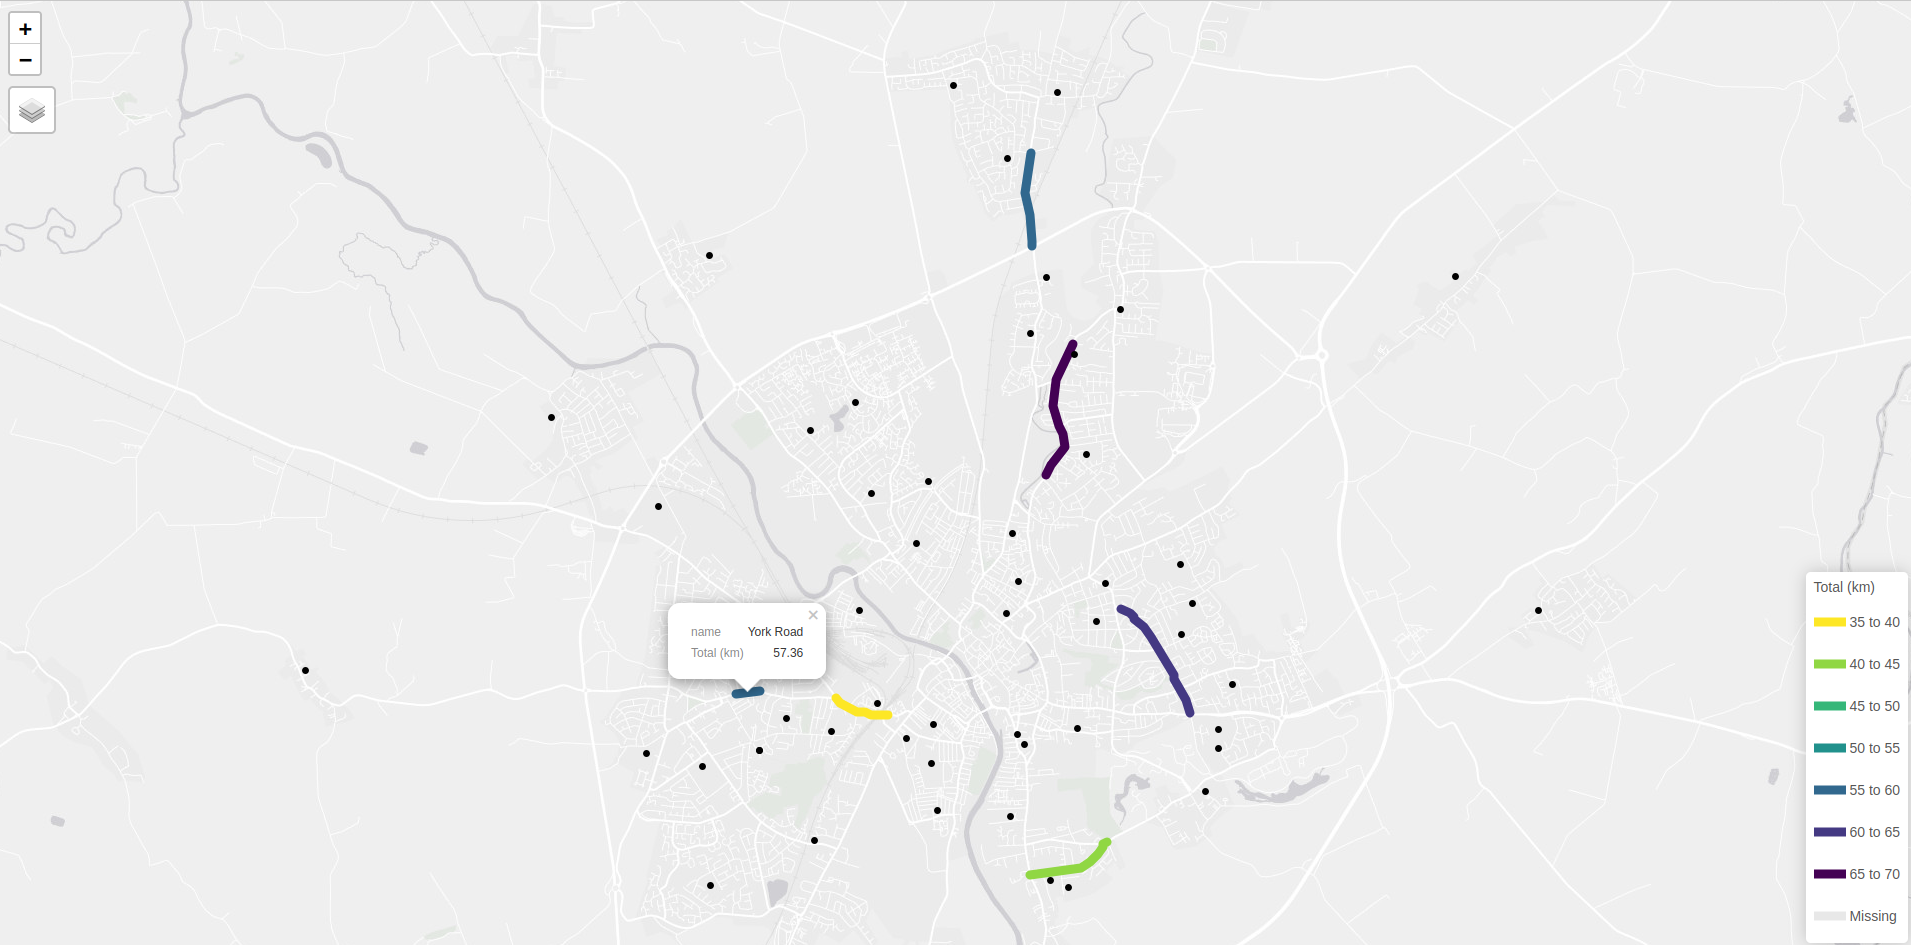
Top 5 routes with the highest number of trips under the Government Target scenario.
| name | Total (km) |
|---|---|
| Huntington Road | 69.3 |
| Tang Hall Lane | 63.2 |
| York Road | 57.4 |
| Heslington Lane | 41.7 |
| Holgate Road | 38.0 |
Combined with local knowledge and other sources of data, such as information on road widths and traffic speeds and volumes, and consultation with local residents and schools, the SchoolRoutes evidence can be used to inform investment decisions. The results also help prioritise from a list of schemes that are already in the pipeline, with Huntingdon Road, for example, being highlighted as a key route for investment in York according to the results.
Sense checking outputs
The results for the synthetic data were sense-checked by comparing the total number of trips and distance travelled represented in the OD dataset with the output of the model.
Assuming a ‘trip diversion factor’ (meaning the distance travelled on the network compared with straight line distance) of 1.4 and that on average 60% of the trips are made by cycling under the Go Dutch scenario for the short distances travelled to school, we can estimate the total number distance travelled by bike to school on a typical school day as 38,431 km. The equivalent for the route network output under the Go Dutch scenario is 55,836 km. Note that the values presented above are based on synthetic OD data, which may not be representative of the actual travel patterns in York.
Let’s compare with the number who cycle under the less ambitious Government Target scenario: The total distance travelled under the Government Target scenario is 4,612 km. These numbers make sense and align well with the peer-reviewed results of the Propensity to Cycle Tool project, as shown in the figure below. A visual approach to quality assurance is to compare the results with the Propensity to Cycle Tool school travel outputs, which are available for York, as illustrated below.
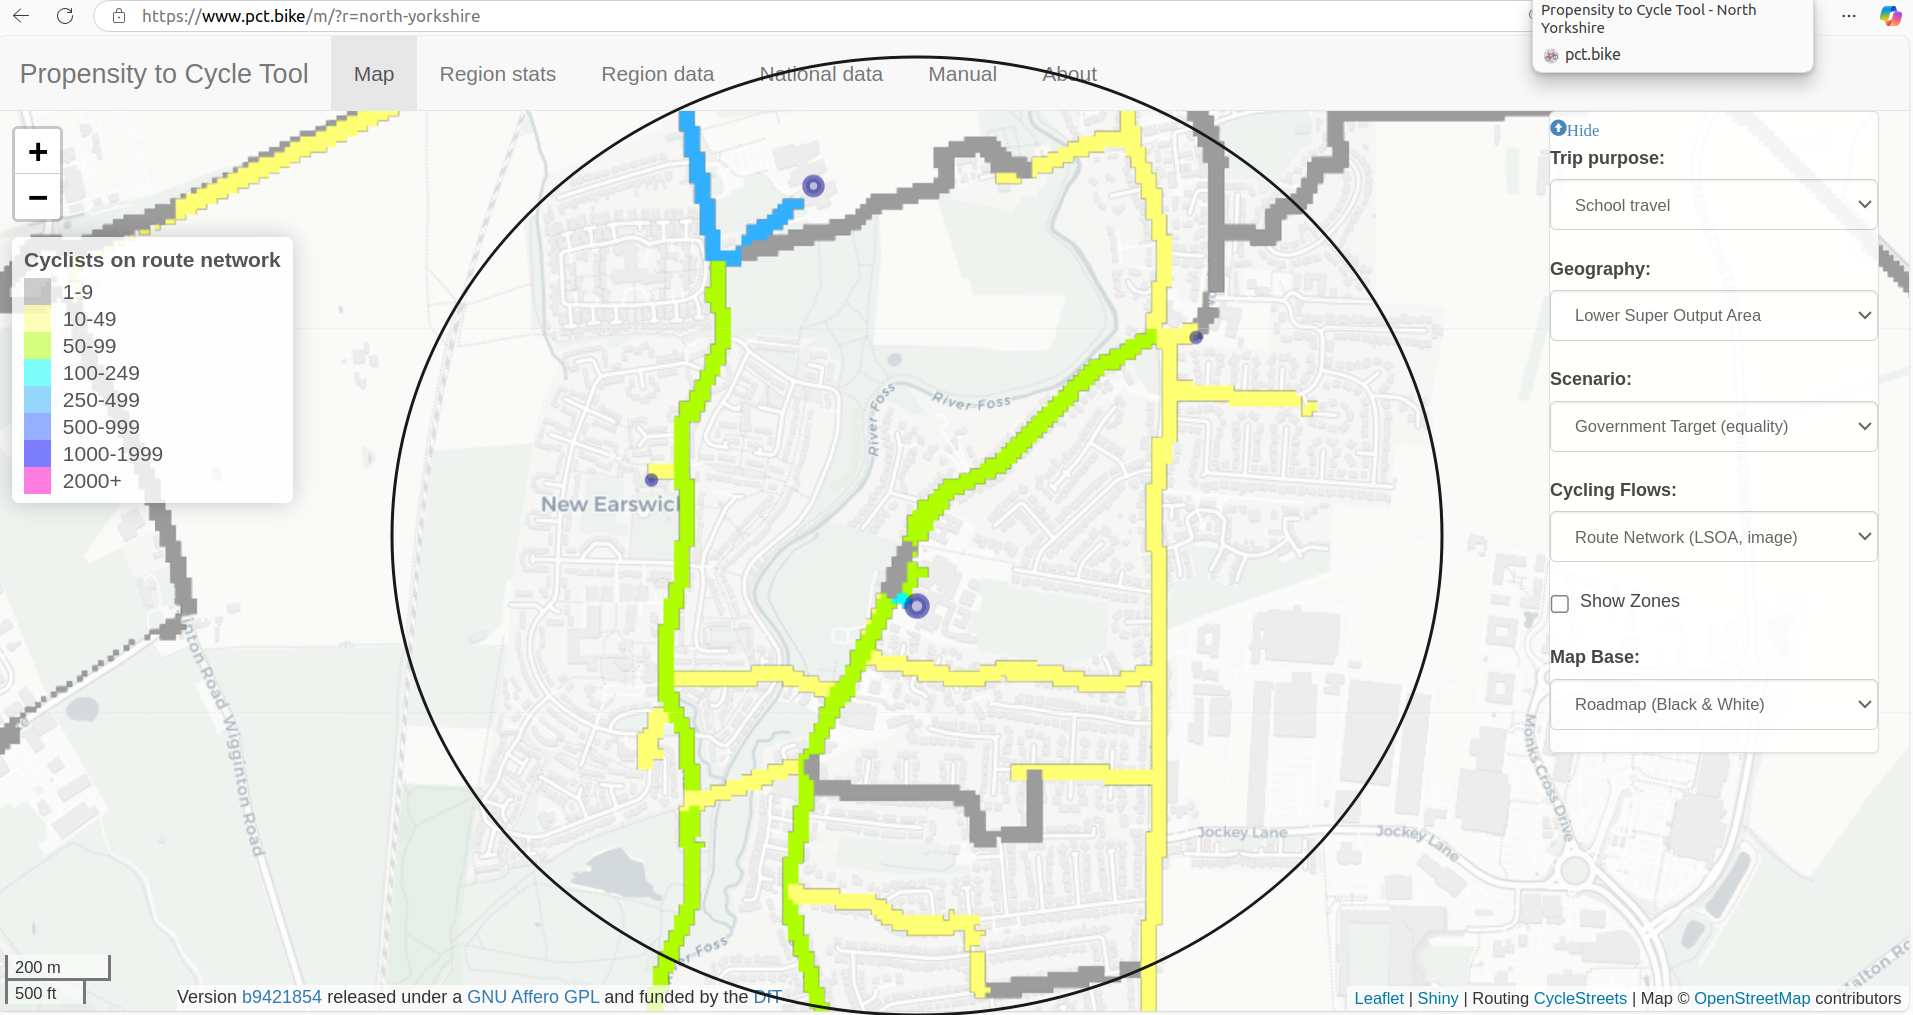
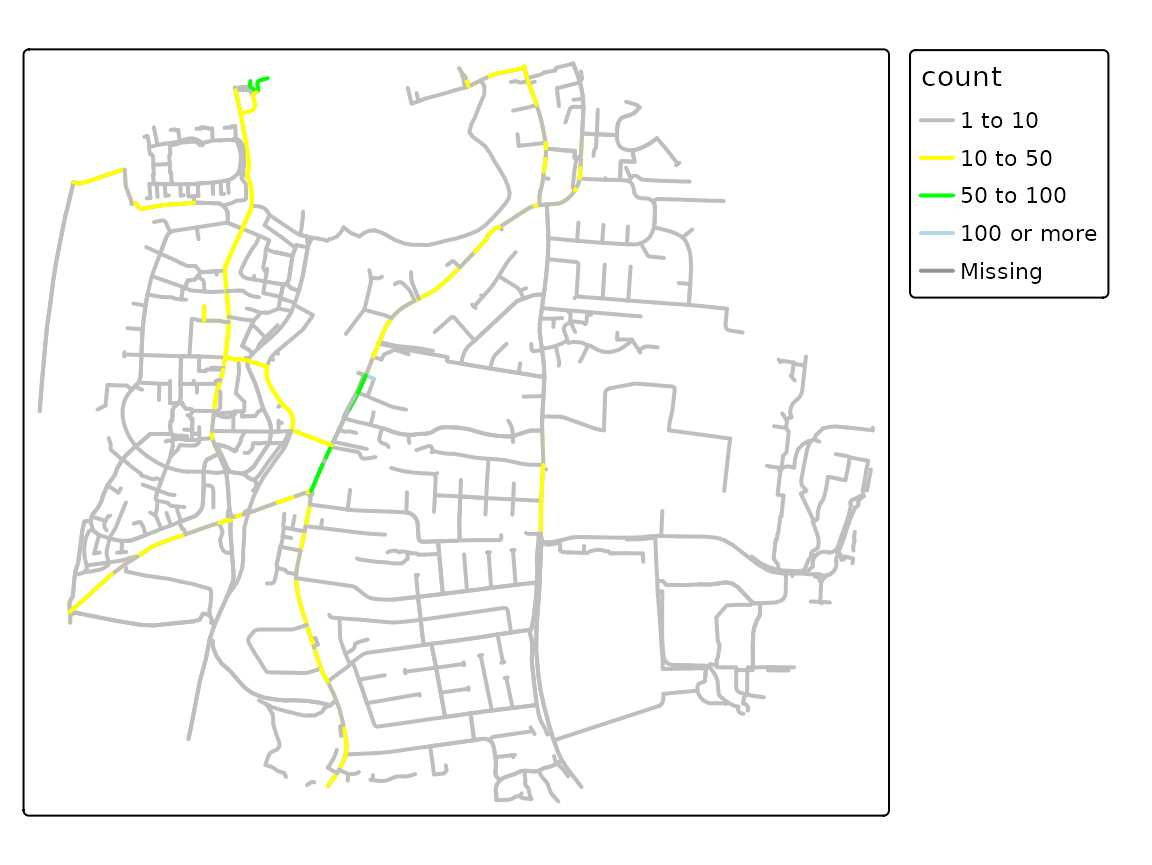
Comparison of Propensity to Cycle Tool school travel (top) and SchoolRoutes (bottom) outputs for York.
Note that while there are differences in the results, the SchoolRoutes outputs presented above are based on synthetic OD data. Despite this, both sets of results highlight the same roads, and the results are on the same scale, which is a good sign that the SchoolRoutes outputs are plausible. It is clear from the SchoolRoutes outputs in the figure above (bottom), that the networks it generates are much denser: most of the roads around the school are highlighted, rather than just a few key routes in the PCT.
Conclusions and next steps
The report has outlined a new approach to estimating the potential
for active travel to school, based on disaggregated OD data and route
network outputs, building on but going beyond the Propensity to Cycle
Tool project (Goodman et al. 2019). Due to
the high computational efficiency of the od2net tool, which
resulted from the grant funding agreement allowing the Alan Turing
Institute to develop the tool, the approach can be applied to any local
authority in England, and potentially beyond, to estimate the potential
for active travel to school.
To deploy the project at scale there is a substantial amount of work to do, including the following (with estimates in days of work):
- Detailed quantitative comparison of results with Propensity to Cycle Tool outputs (5-10 days)
- Validating the results against ground truth data for a single local authority (5 days)
- Refining the parameters in the walking uptake (and potentially cycling uptake) functions (5-30 days)
- Integration of ModeShift Stars data and Census data to generate better baseline data (10-30 days)
- Inclusion of gradient data, gradient is not included in the walking or cycling routes or uptake model currently (5-20 days)
- Sense-checking results based on local knowledge with input from inspectors and/or local authority staff and, optionally, collaborating with partners to gain feedback and improve the approach based on that feedback (5-30 days)
- Running the tool for every local authority in England (10-20 days)
- Development of front-end tools for visualising the results (5-50 days depending on level of sophistication)
- Presenting results to stakeholders in workshops (5 days)
- Writing case studies of how to use the tool in collaboration with local authorities (10 days)
- Training local authority staff to use the tool (5-20 days)
- Integration into the browse tool in the
atipcodebase, (see plan.activetravelengland.gov.uk) (10 days) - Writing up the results in a peer-reviewed journal article (10 days)
In total, the project would require around 100-250 days of work, depending on the project’s ambition and scope. It may be worth chunking the project into 2 distinct phases, e.g. a pilot for a handful of local authorities (e.g. 20 days’ work), followed by a full rollout to all local authorities in England. With the potential to have a substantial impact on active travel to school in England, and to provide a foundation for a next-generation strategic active travel network planning tool going beyond the now-outdated Propensity to Cycle Tool, the project is well worth pursuing.